Starling
Solo Full-Stack Engineer · Data
Map public networks around a handle as explainable graphs, not a black box.
- Timeline
- 2025 to 2026
- Stack
- Next.js, React, TypeScript, Tailwind CSS, D3.js, Graph data modeling, Apify, react-force-graph-2d, Vercel
Overview
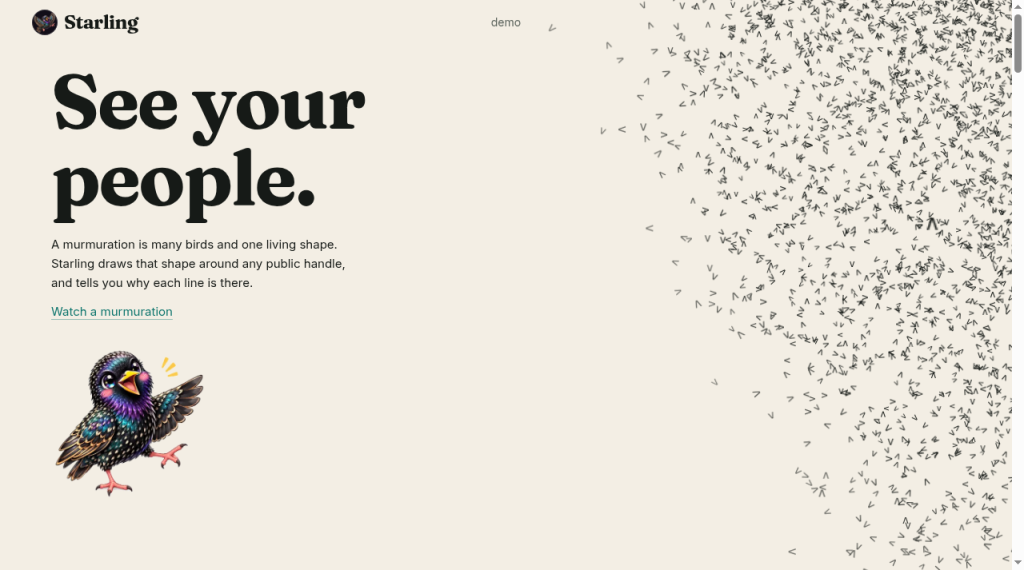
Starling charts visible interaction, audience, and taste from public handles across major platforms. The committed demo at /demo runs from frozen snapshots so you can explore without live scraping.
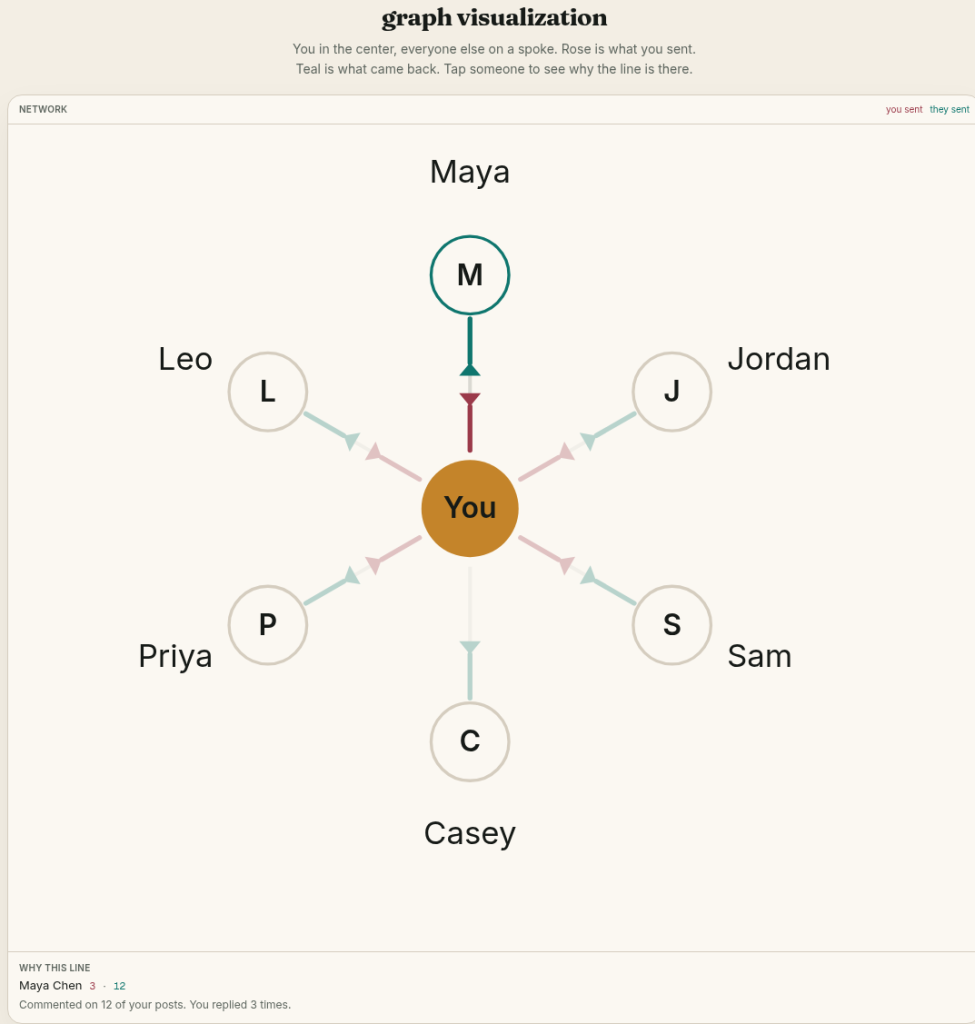
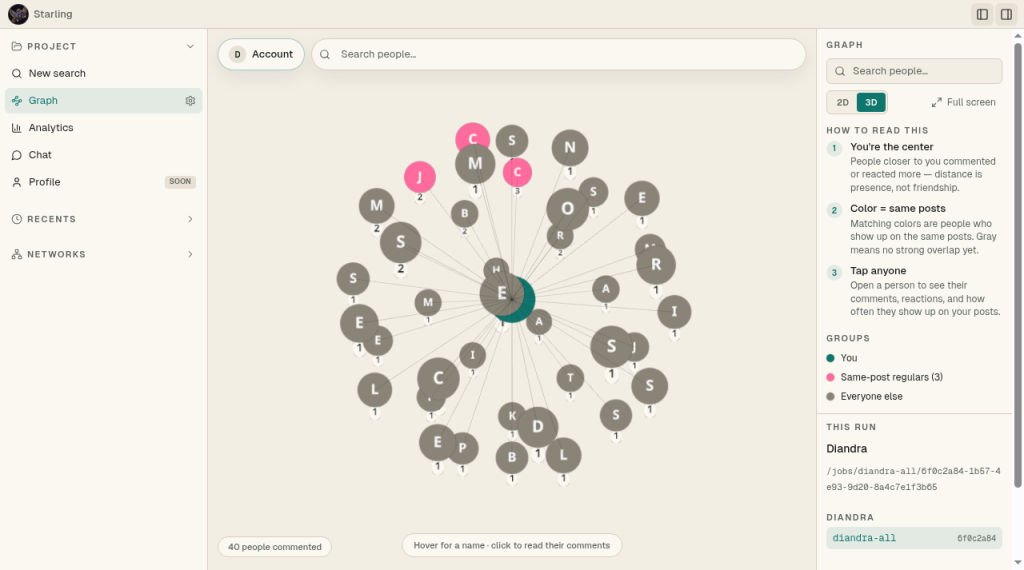
Social activity is modeled as nodes, weighted edges, and engagement-based clusters. Proximity maps put you at the center: distance reflects how often someone shows up, not a friendship score.
Platform-native layouts cover TikTok hashtags, Spotify genres, and LinkedIn company hub-and-spoke views.
What I built
- Multi-platform graphs for LinkedIn, Instagram, Facebook, TikTok, and Spotify
- Graph data modeling with D3.js and force-directed views for relationship ranking and shared-engagement communities
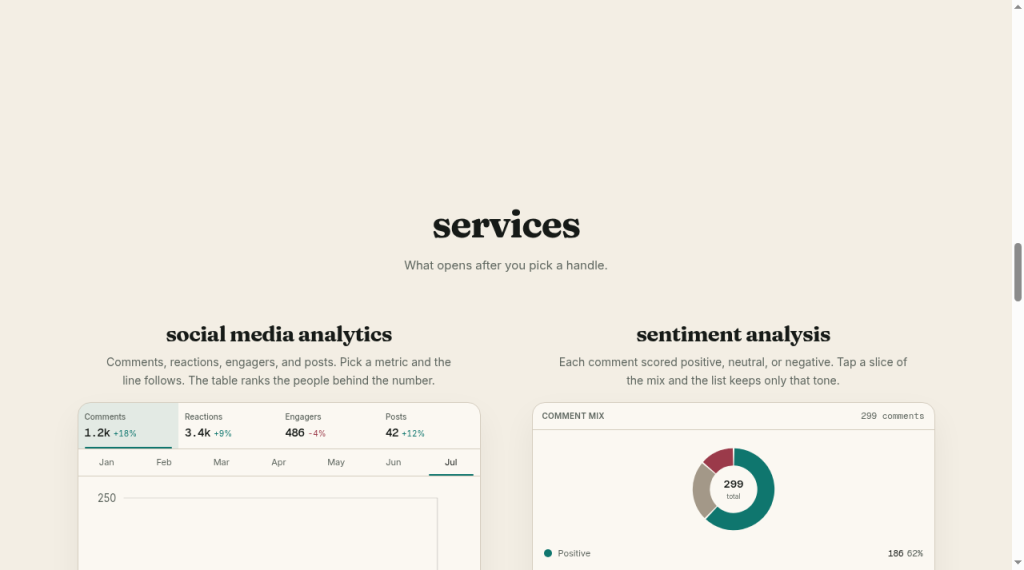
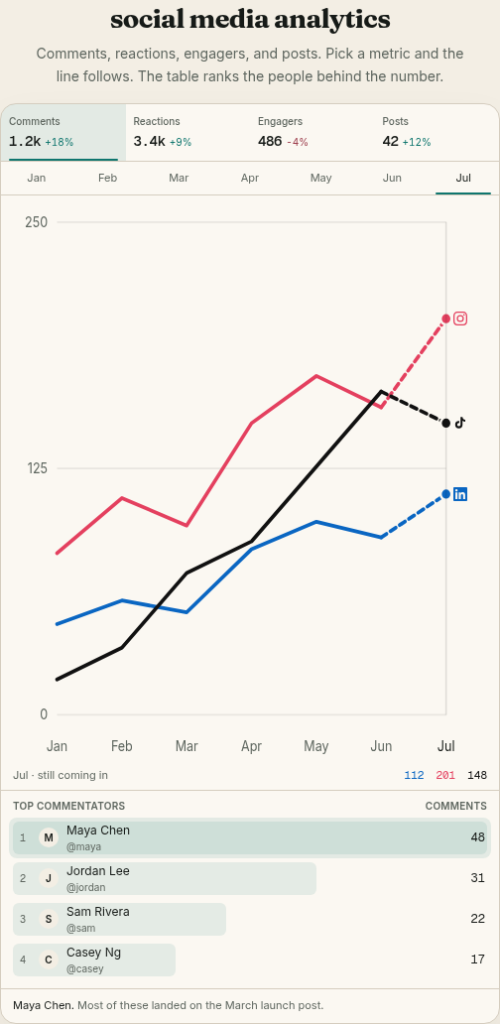
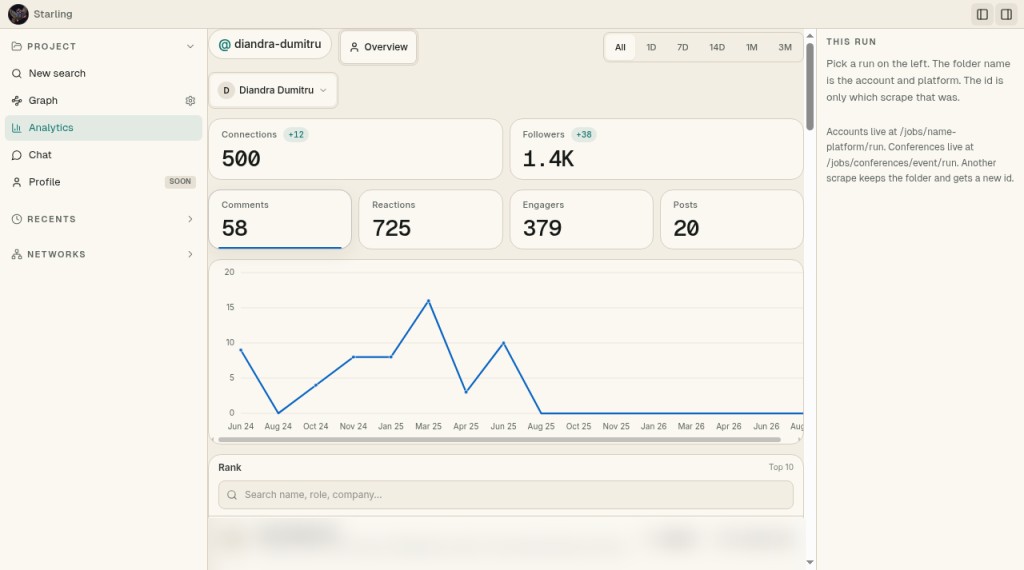
- Engagement analytics with time ranges, top engagers, and posts over time
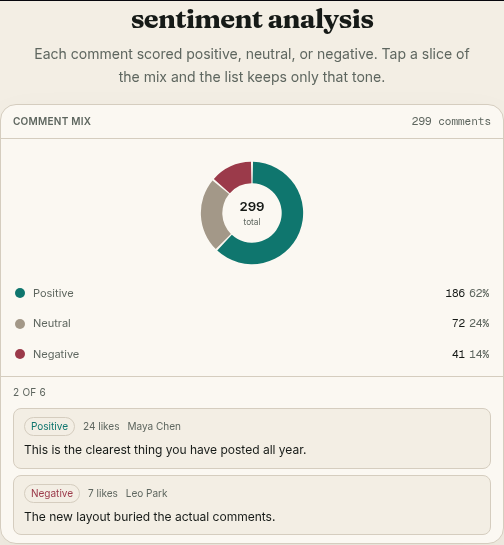
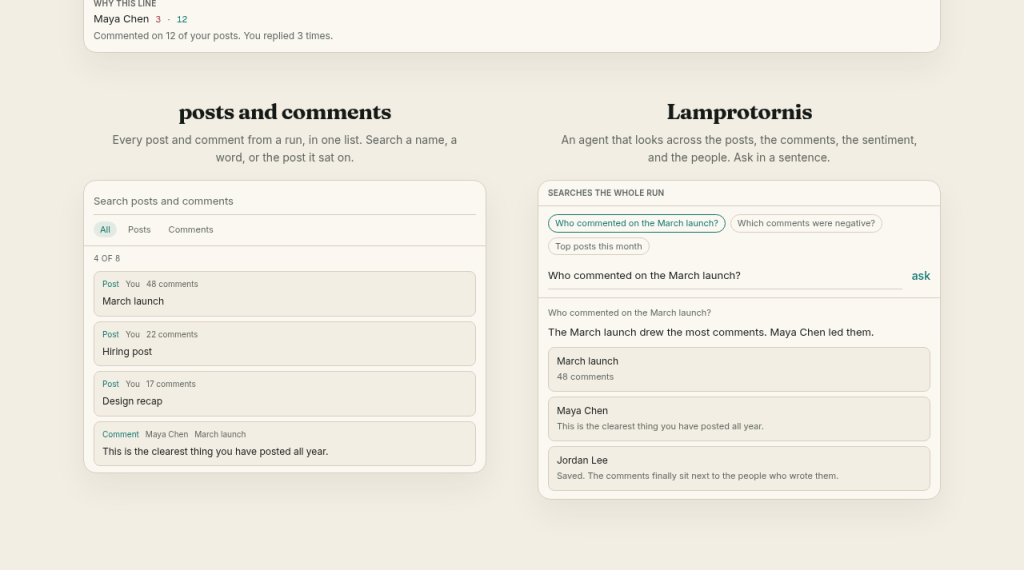
- Traceable views of comments and reactions behind graph edges
- Explainable network graph in 2D or 3D with a how-to-read guide
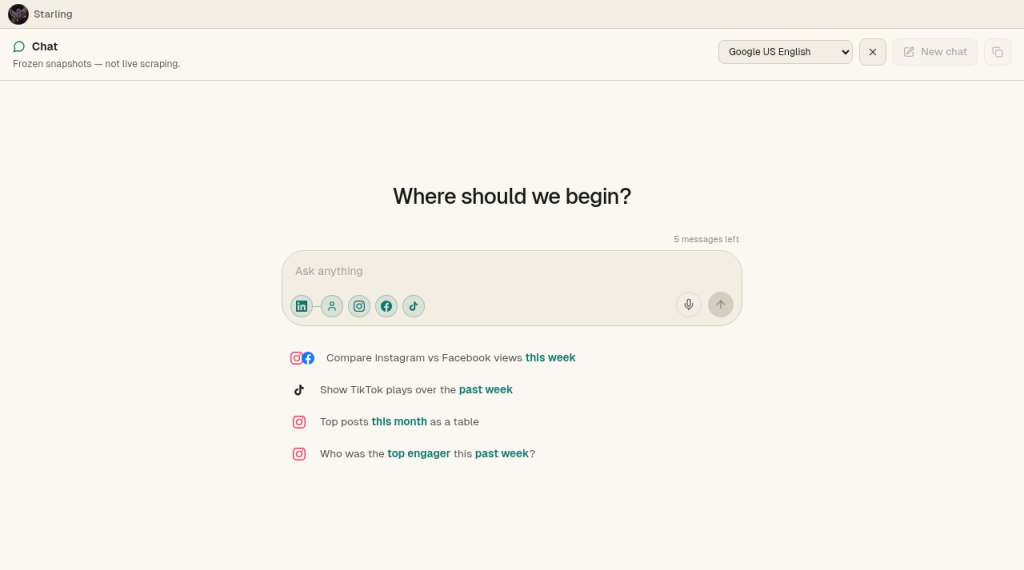
- Chat to ask the graph questions with per-visitor quotas
- Shareable pinned snapshots for demos
Tech
Next.jsReactTypeScriptTailwind CSSD3.jsGraph data modelingApifyreact-force-graph-2dVercel
Screens
Next project
Hermes Bots · AI